CUSTO DE VIDA
Commercial rent in Canada: StatCan's new CRSPI index is now available
In this article
StatCan released the CRSPI Q1 2026: commercial rent index for 13 CMAs plus the 4 largest provinces. What it means for a Brazilian who wants to start a business.
Look, this one is data for anyone thinking about starting a business in Canada: Statistics Canada just released, on May 21, 2026, the new batch of the CRSPI, the Commercial Rents Services Price Index, with data for the first quarter of 2026. It’s not the kind of release that makes headlines in the Globe and Mail, but it’s the tool that separates a Brazilian who signs a commercial lease knowing what they’re doing from one who finds out, two years later, that they paid 30% above market.
And there’s an important feature to understand before anything else: there is no headline number in the body of the release. StatCan basically announces “look, the new CRSPI batch is out”, and anyone who wants the quarterly change percentages has to click the link and go into the Prices Analytical Series data tables. This confuses a lot of people who open the link expecting to read “commercial rents rose 1.4% in Toronto” and find no sentence like that anywhere.
For the Brazilian thinking about opening a café in Vancouver, a shop in Toronto, a studio in Montréal or a consulting office in Calgary, the CRSPI is the index that tells you whether the price the landlord is asking in the lease is “in line with the market” or whether they’re testing the newcomer.
What is the CRSPI and why does it matter for a Brazilian entrepreneur?
The Commercial Rents Services Price Index is Statistics Canada’s quarterly index that measures the price change of net effective rent per square foot in occupied commercial buildings, retail, office, industrial and warehouse, across 13 metropolitan areas (CMAs) in Canada. It’s the cousin of the residential CPI, but for commercial property: while the CPI tells you whether your apartment rent went up, the CRSPI tells you whether the rent on the shop, café or office you’re looking at went up.
For the Brazilian entrepreneur, it matters for one simple reason: commercial rent is, in almost every small-retail business plan, the biggest fixed cost after payroll. Getting your rent estimate wrong by 20% destroys the margin of any café, any neighbourhood shop, any consulting office. And the small Brazilian entrepreneur who just arrived almost never has a market benchmark: they don’t know a commercial broker, they have no track record in Toronto or Vancouver, and they tend to accept the first number the landlord puts on the table.
The CRSPI changes that game. If the index shows that commercial rent in Toronto stabilized last quarter and the landlord is asking you for 8% more than the previous lease on the same spot, that’s a red flag worth a conversation before signing.
How much does commercial rent cost in Toronto, Vancouver, Calgary and Montréal?
This is where the StatCan release frustrates the reader: the body of the announcement does not give absolute numbers, neither “average commercial rent in Toronto is X per square foot” nor “Vancouver rose Y% in the quarter”. The announcement states that the data is available, and anyone who wants the headline numbers has to open the Prices Analytical Series tables.
What the release does confirm is the geographic coverage: the CRSPI publishes a separate index for Montréal, Toronto, Calgary and Vancouver, the four CMAs where most Brazilians live and where most Brazilian small businesses set up. It also publishes an index by building type (retail vs office vs industrial vs warehouse) at the national level and for the 4 largest provinces: Ontario, Quebec, Alberta and British Columbia.
The practical read: if you’re looking at a commercial spot in one of the four big cities, you can cross-reference your city’s index with your building-type index and get a reasonable benchmark. In a smaller CMA, Halifax, Winnipeg, Edmonton, Saskatoon, Ottawa, you get the CMA index, but not the breakdown by building type.
How is commercial rent different from residential?
The most important difference for the Brazilian who has never leased a commercial spot in Canada has a technical name: net effective rent. StatCan’s official definition is “the price charged to all tenants to physically occupy the building space each month, including any incentives and excluding all operating costs, taxes and additional rents”.
Translation for whoever is about to sign: the number in the CRSPI is the “base” rent, and it does not include what Canadian real-estate jargon calls CAM charges (Common Area Maintenance), property tax pass-through, building insurance, or shared maintenance. In a typical retail lease in Toronto or Vancouver, these extras add 30% to 60% on top of the base rent. The Brazilian who looks at the CRSPI and calculates the café’s margin using only the headline number is going to get a nasty surprise when the first landlord statement arrives with property tax plus CAM plus insurance baked in.
Another common confusion: asking rent (what the landlord asks for) versus net effective rent (what actually becomes the price after incentives like free months, build-out allowance, or rate adjustment). The CRSPI measures the effective rent, not the asking one. That helps calibrate expectations: if the listing says $50 per square foot but the CRSPI for your CMA suggests the effective rent is closer to $42, that’s a documented negotiation margin.
Where do you find the full CRSPI data?
The entry point is the release itself in The Daily, dq260521d-eng.htm. The announcement links to the data tables where the quarterly index is published by CMA, province and building type. For the Brazilian entrepreneur, three things are worth clicking: the aggregate index for the CMA where you want to open the business, the provincial index for context, and the index by building type (retail vs office vs industrial) to look at the category you need.
It’s also worth reading the methodology document that StatCan references, “Methodology of the Commercial Rents Services Price Index”, published inside the Prices Analytical Series. It’s dry reading, but it’s where they explain how the index handles revisions: the previous quarter’s figure can be revised with each release. Anyone who’s going to use the CRSPI as a lease benchmark needs to know that the Q4 number you read three months ago may be different today.
One last technical note: the index is not seasonally adjusted. Comparing Q1 2026 against Q4 2025 without adjusting for seasonality can mislead you. The valid comparison is Q1 against Q1 of the previous year, or looking at the 4 to 6 quarter trend instead of a single quarter-over-quarter delta.
Frequently asked questions
Does the CRSPI Q1 2026 release give commercial rent change percentages?
Does the CRSPI cover Toronto, Vancouver, Calgary and Montréal separately?
What is the difference between net effective rent and the rent I will actually pay?
Why is the CRSPI not seasonally adjusted and what does that change?
Sources
- Statistics Canada, Commercial rents in key Canadian economic markets, first quarter 2026 (The Daily, dq260521d, published 21/05/2026)
- Methodology of the Commercial Rents Services Price Index, Prices Analytical Series (linked from the release)
The Vancouver Letter
You made it this far. That tells me something.
The Vancouver Letter is the letter I wish someone had sent me the third time I tried for Canada, when I had no idea what I was doing wrong. Once a week, straight to your inbox. No products, no courses, just what actually works. I got your back.
Get immigration updates
Practical tips straight to your inbox.
Related articles
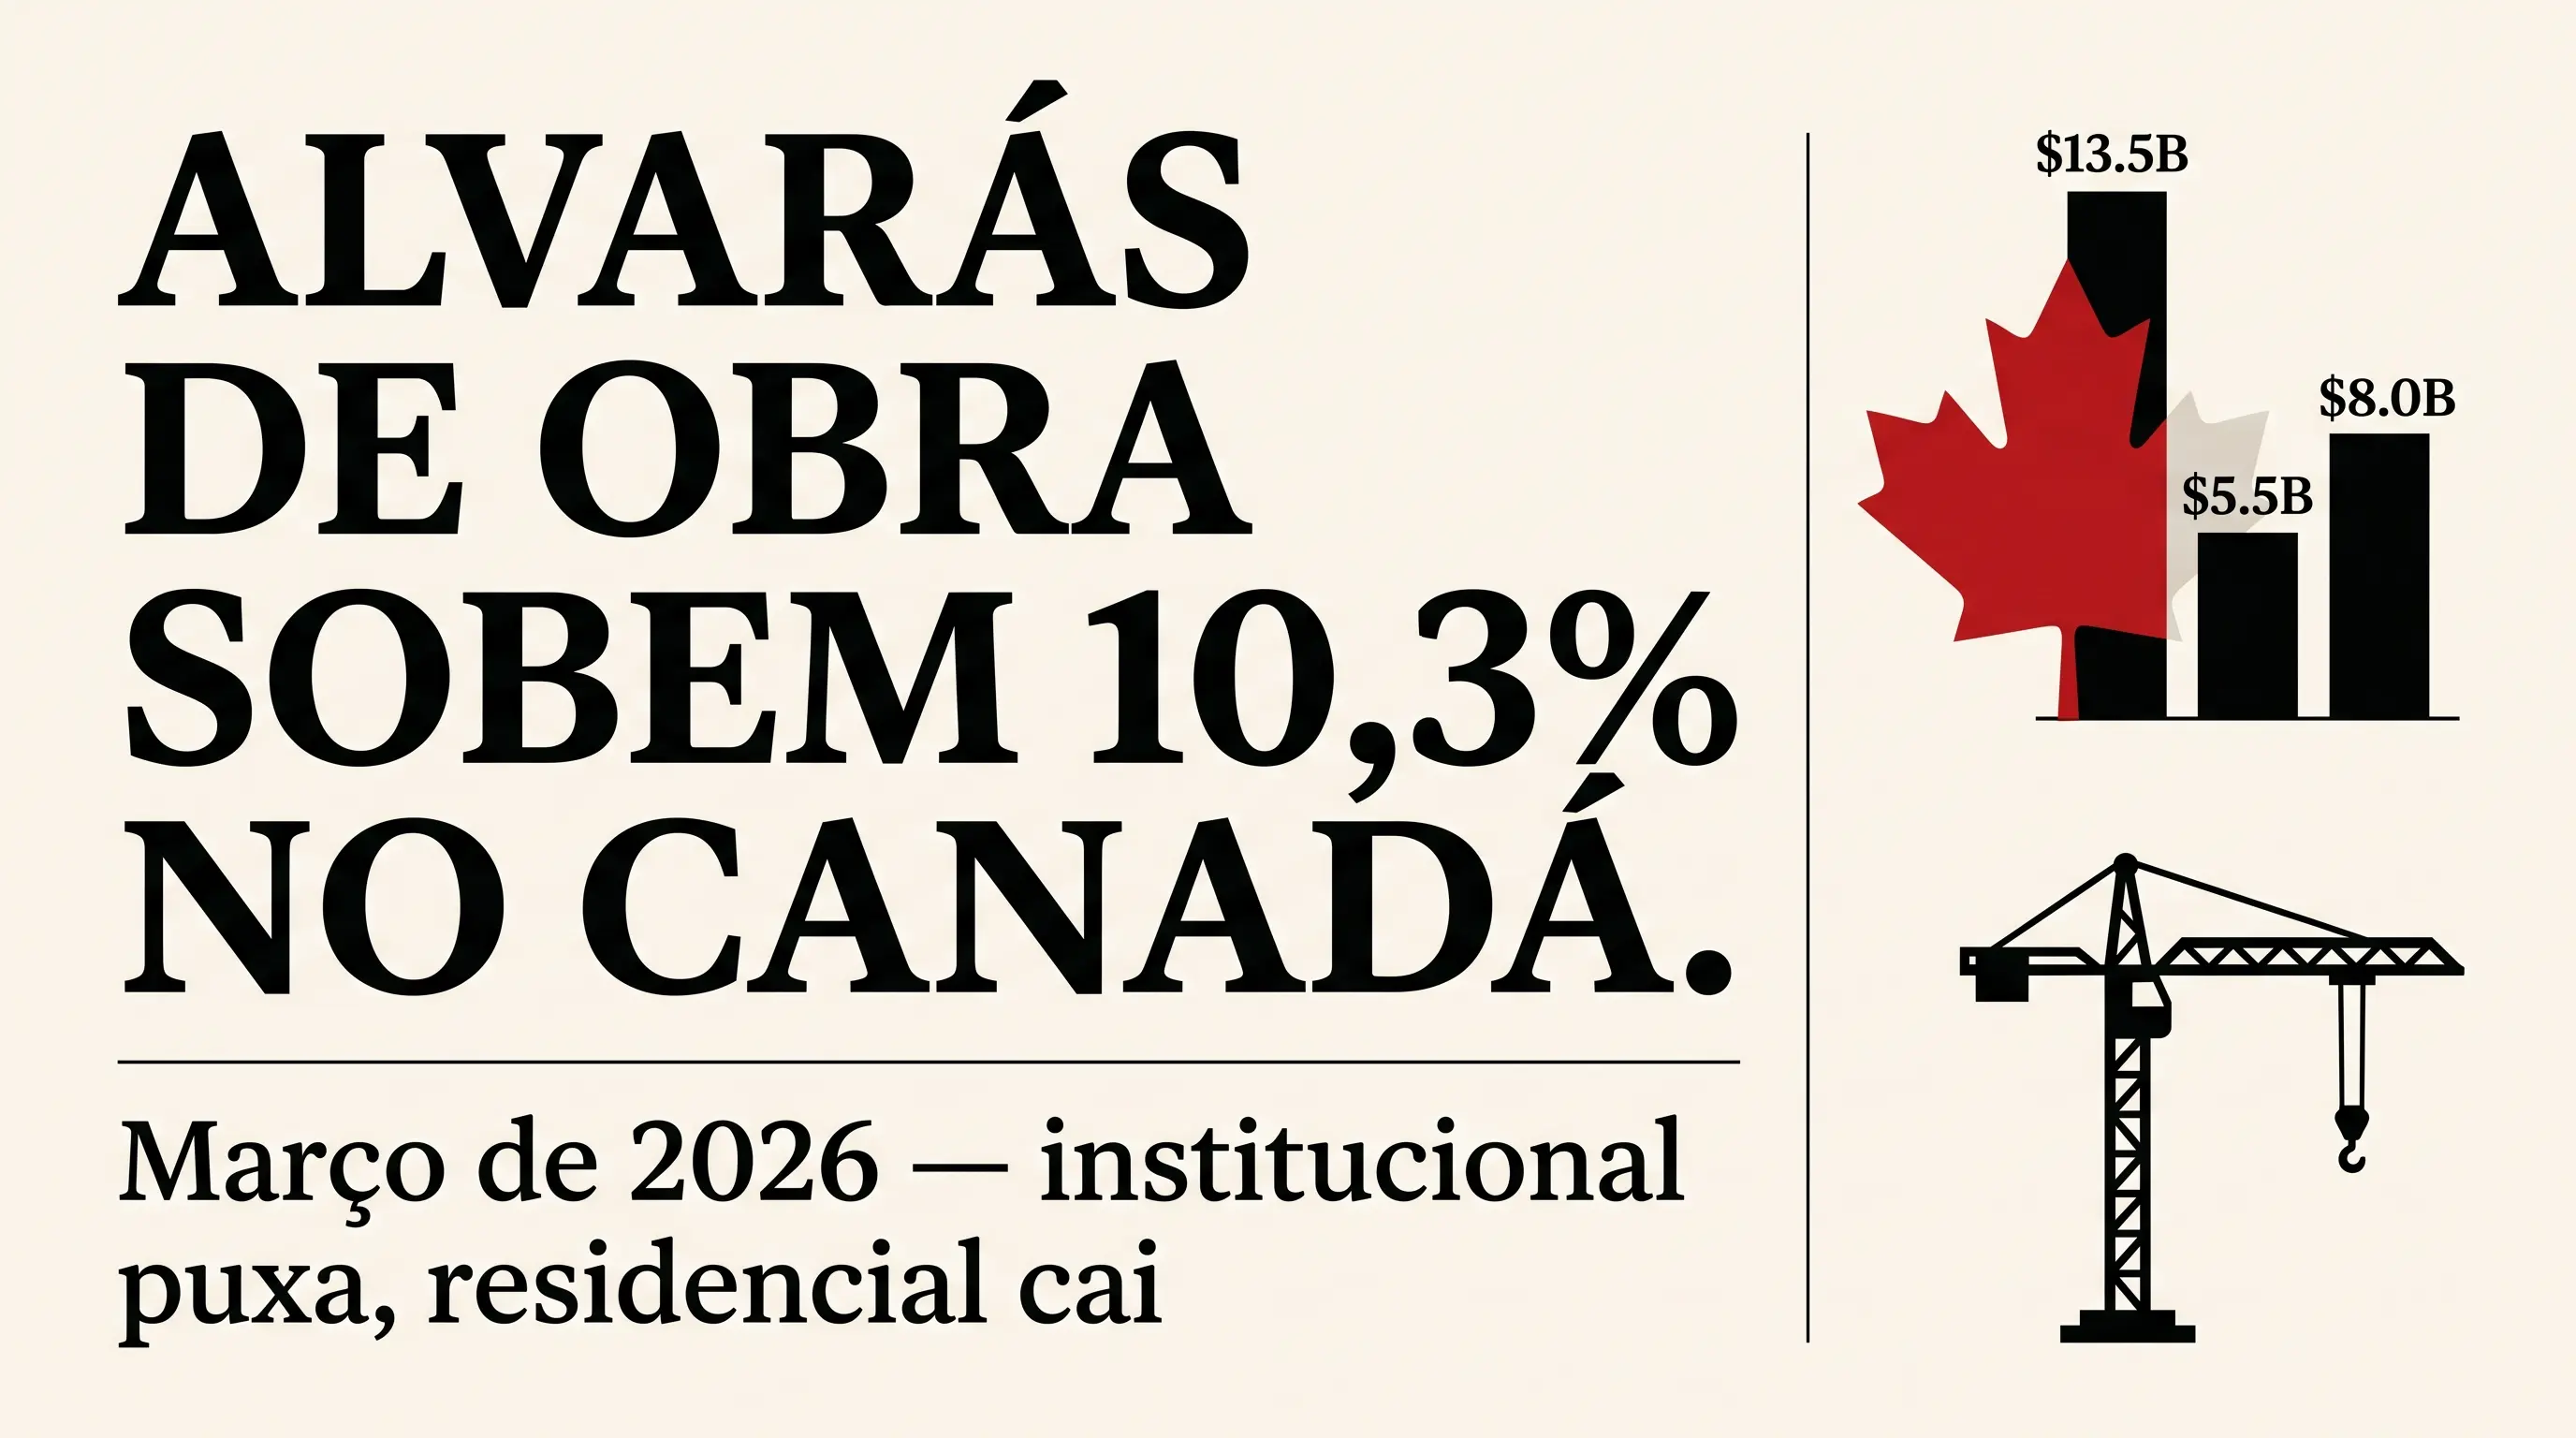
Canada building permits rise 10.3% in March 2026
Canada building permits hit CAD 13.5 billion in March (+10.3%). Vancouver led institutional with a hospital; multi-family fell in ON/QC.

Canada's GDP stalled in Q1 2026, and the direction is downhill
Canada's GDP was flat (0.0%) in Q1 2026 after falling 0.2%. Technically not a recession yet, but the economy is losing steam.
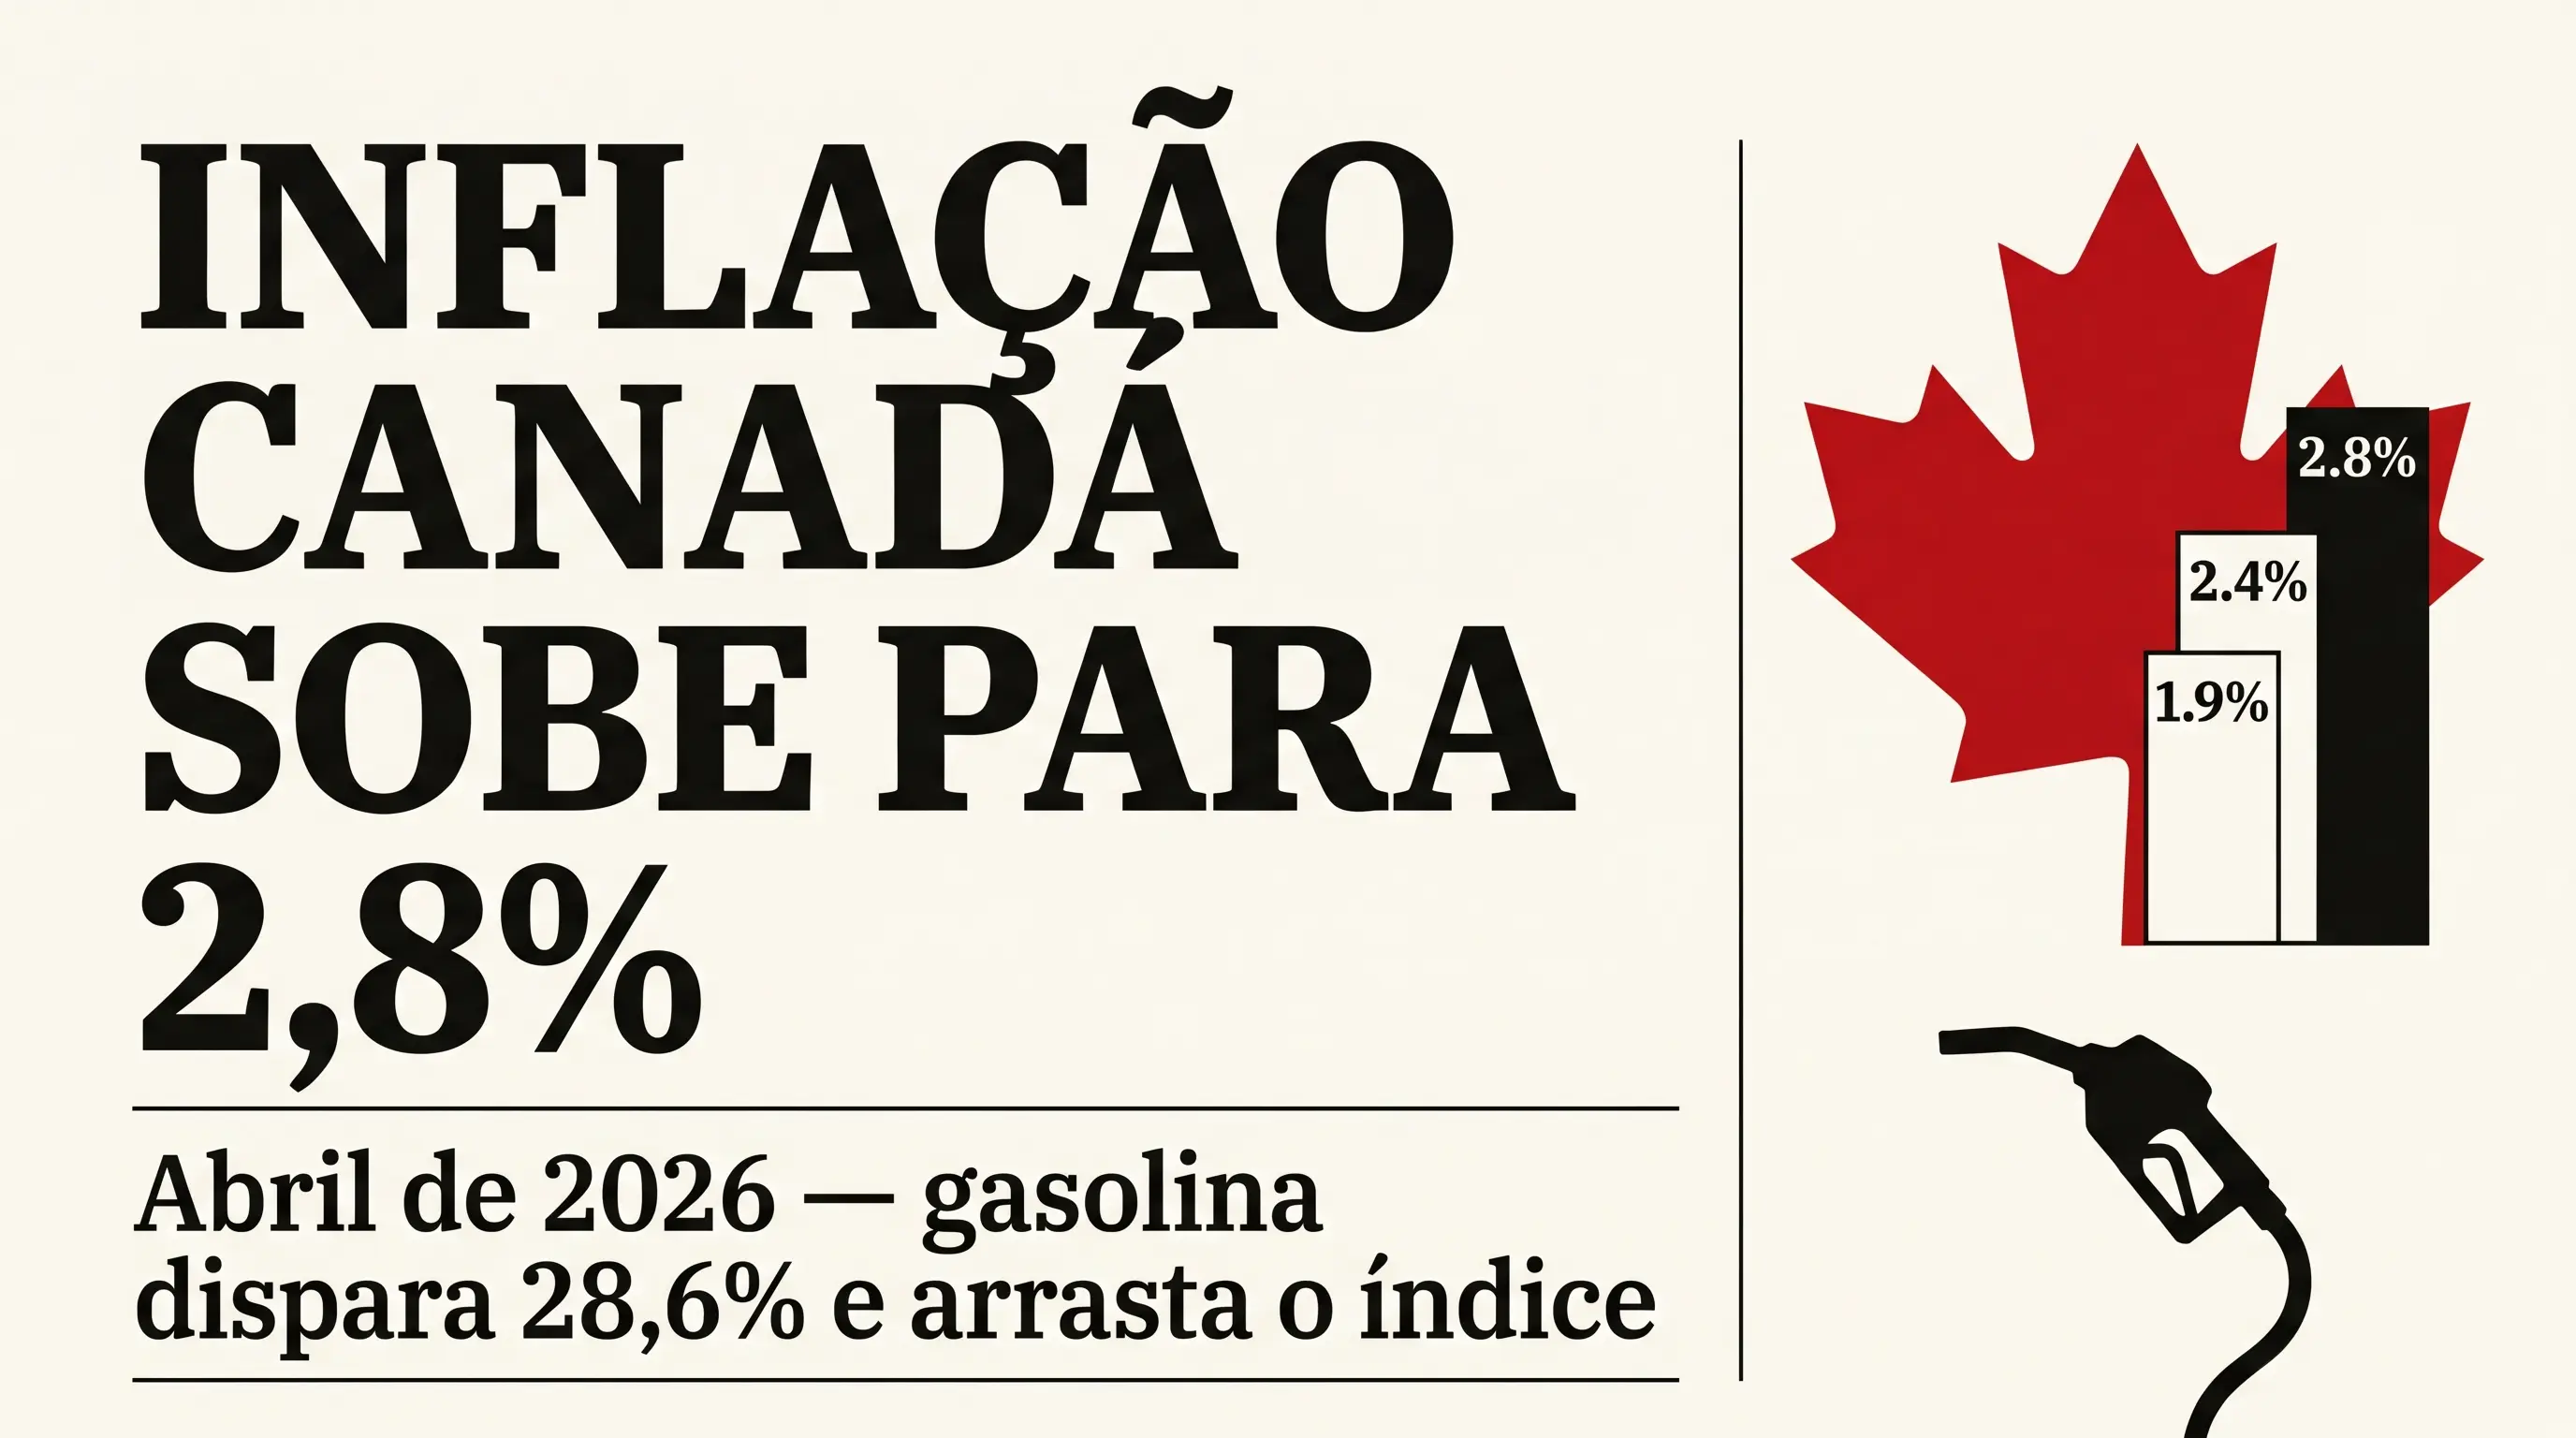
Inflation in Canada in April 2026: why CPI rose to 2.8%
CPI rose to 2.8% in April 2026 (was 2.4% in March). Gas jumped 28.6% and dragged everything up. Rent slowed, and in BC even more.