CUSTO DE VIDA
Retail and employment insurance in Canada in March 2026: the paradox
In this article
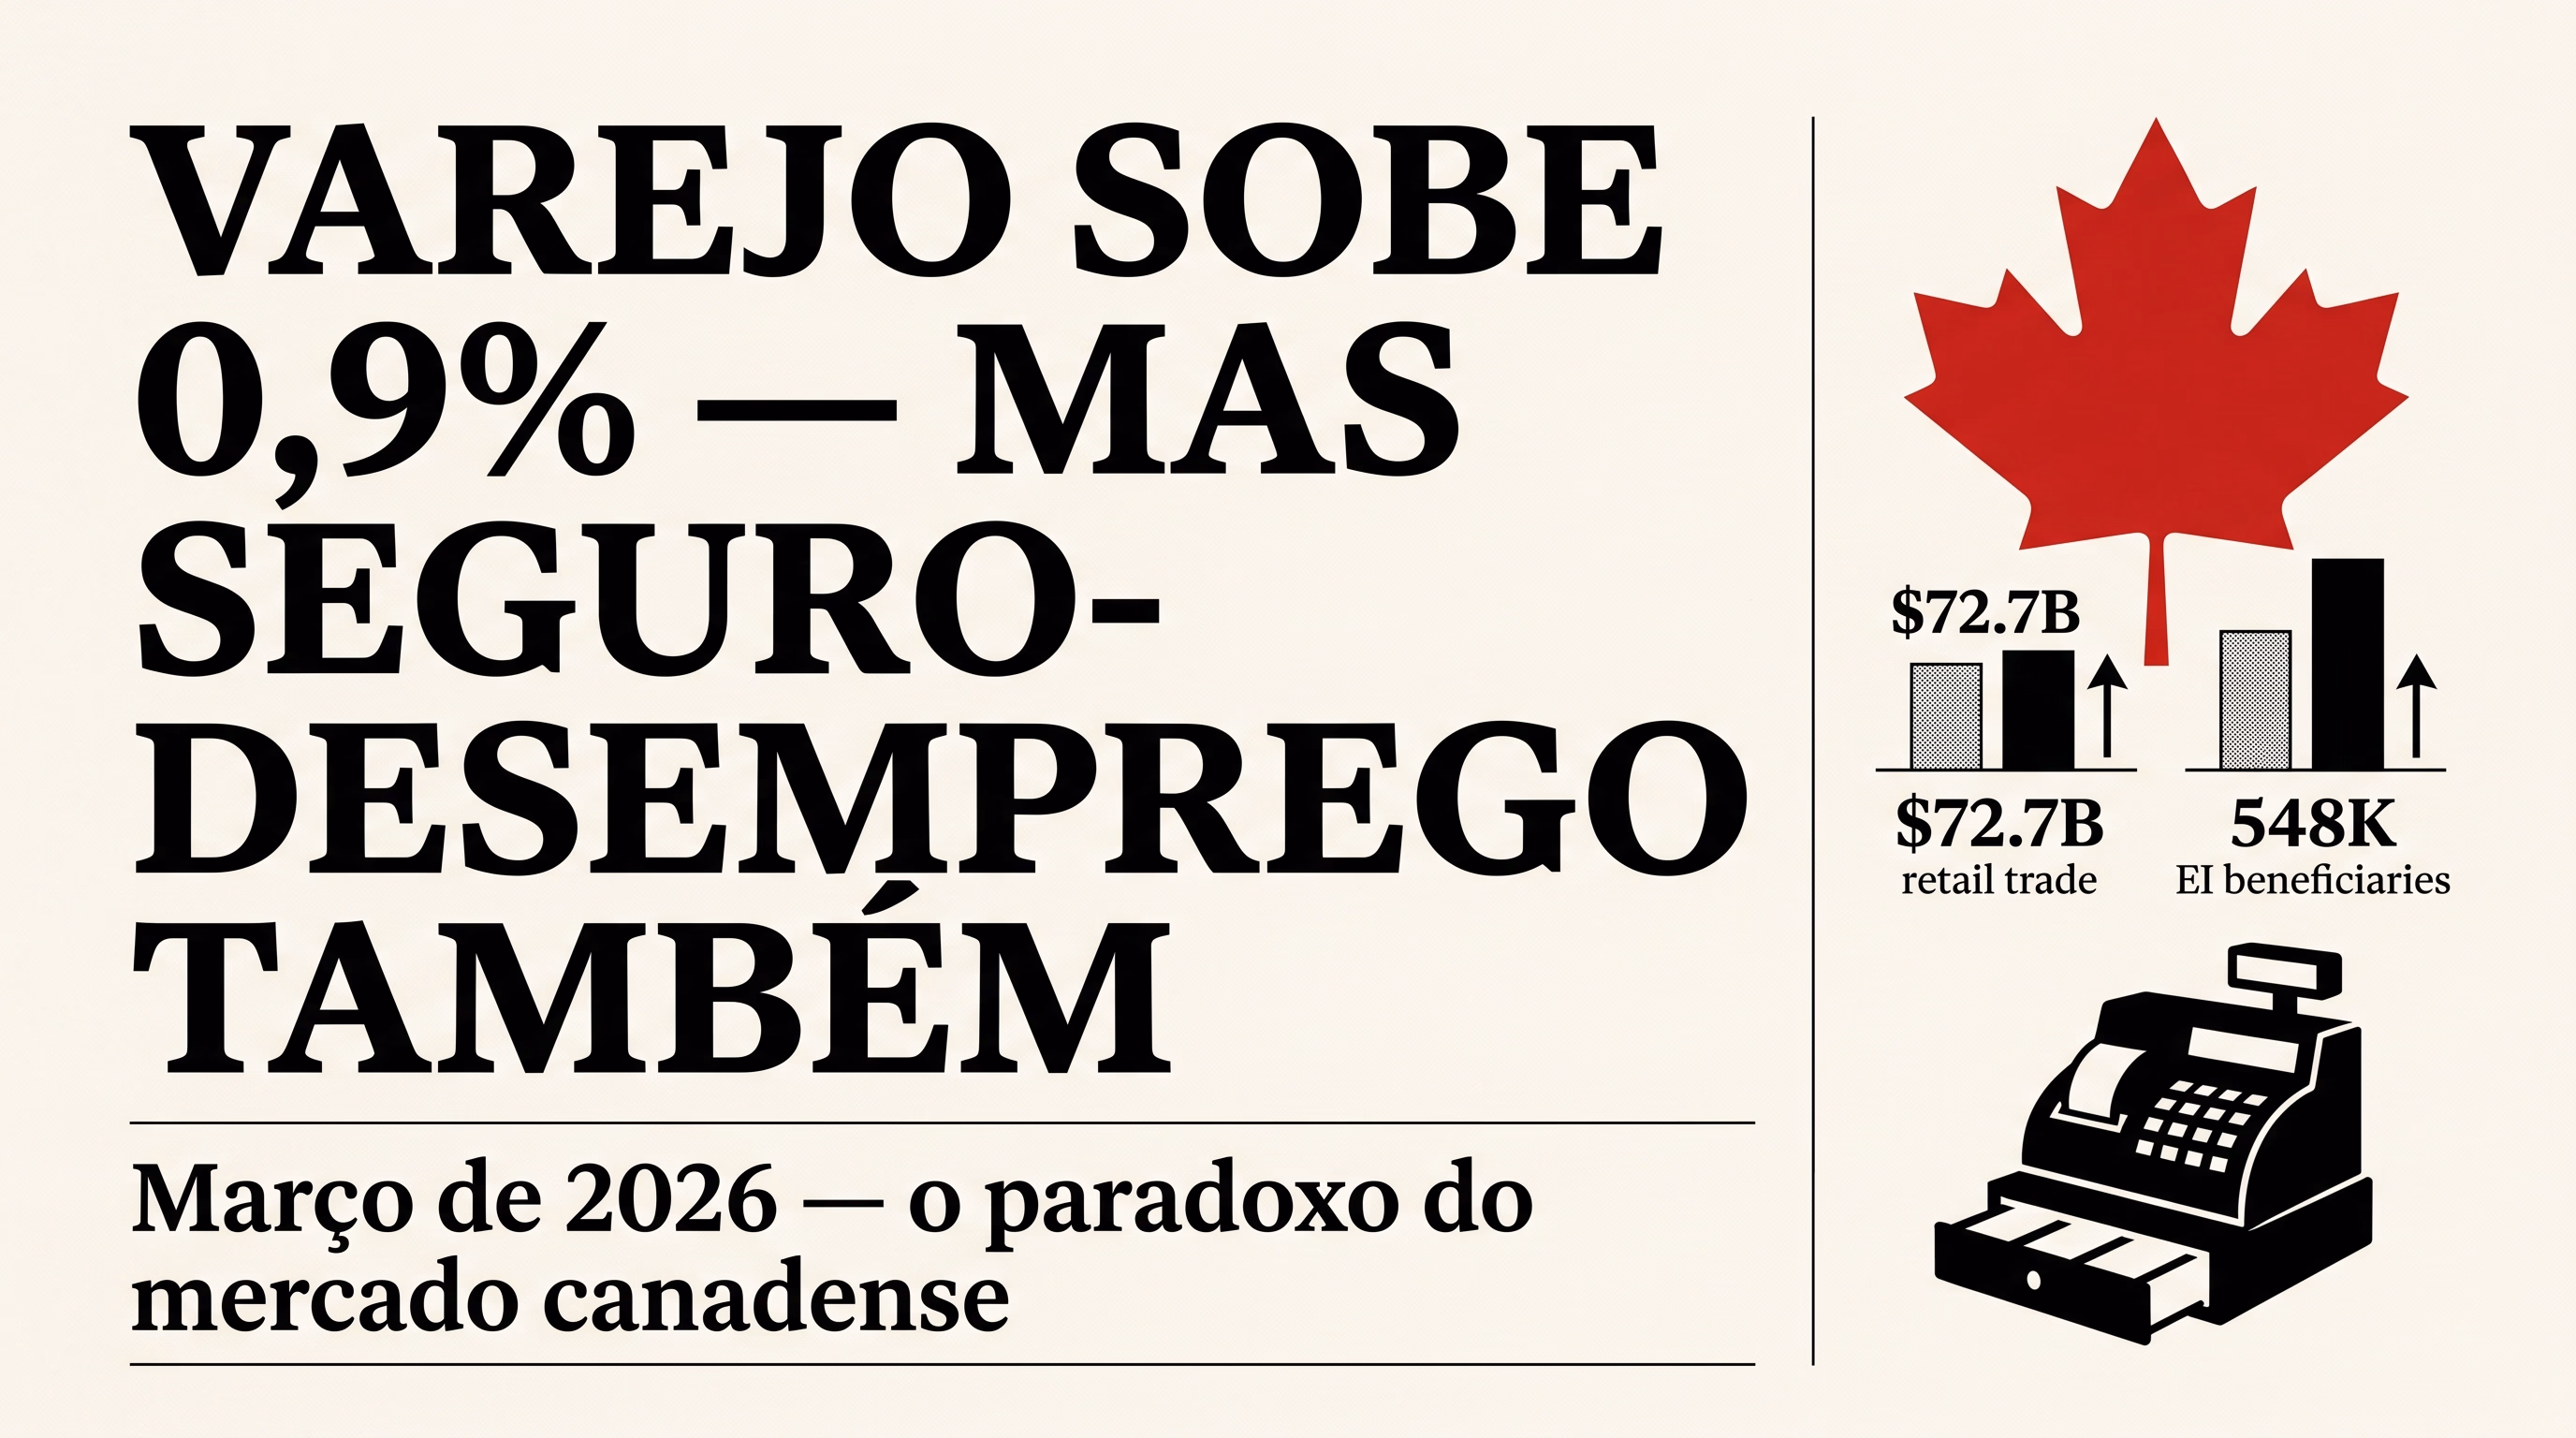
Canadian retail rose 0.9% in March (CAD 72.7B) but excluding gas it fell 0.1%. EI rose 8.7% over 12 months; Ontario leads at +22.2% YoY.
These two numbers landed together in the Statistics Canada Daily on Friday (May 22, 2026) and they tell ONE story, not two. Canadian retail hit CAD 72.7 billion in March 2026, +0.9% over February, and the headline will run in the papers saying “spending grew.” But the engine of that growth was gasoline (+12.4%), not a newly arrived Brazilian buying food or clothes. If you strip out gas and cars, what StatCan calls core retail, sales fell 0.1%. In real volume, meaning after stripping out price, retail fell 0.7%.
And at the same time, the number of Canadians on employment insurance rose to 548,000 in March, +8.7% over 12 months, which is 44,000 more people collecting EI than in March last year. British Columbia alone rose +22.2% on the year (62,500 beneficiaries). Ontario, +11.1% YoY, now has 186,560 people in the program.
Look at the paradox: retail “grew” because gas got expensive, and at the same time more people are drawing EI. Whoever still has a job is buying less. Whoever doesn’t is applying more. For the Brazilian who sent 500 resumes to retail in Toronto or Vancouver and got nothing back, this is the macro picture that explains why.
How much did Canadian retail rise in March 2026?
Total retail in Canada was CAD 72.7 billion in March 2026, up 0.9% over February. Sales rose in 4 of the 9 subsectors measured by Statistics Canada, with the growth driven by gas stations and fuel vendors, which rose 12.4% in a single month. In 9 of 10 provinces retail rose; only Quebec pulled back (-0.8%, with the Montréal CMA down 2.0%). In the first quarter of 2026, retail grew 2.1%, the seventh straight quarter of gains.
Why did retail rise but “real volume” fall?
Because what rose was the price of gas, not units sold. When StatCan excludes gas and automobiles, a metric called core retail, retail fell 0.1% in March, after two months of gains. In real volume (stripping out price inflation), total retail fell 0.7%, and volume at gas stations fell 1.9%, meaning Canadians filled up FEWER tanks in March, they just paid more per litre. Car dealers fell 0.5% (used -4.0%, new -0.1%), building materials and garden supplies fell 2.9%, general merchandise stores pulled back 0.5%, their first decline in three months.
How much did e-commerce grow and what share of retail is it?
E-commerce in Canada was CAD 5.1 billion in March 2026, up 1.5% on the month. That is 7.1% of total retail, against 7.0% in February, a tenth of a point more, within the normal margin. Statistics Canada also released a provisional estimate of +0.6% for April, but it is important to note this estimate came with a response rate of 52.1% (vs the 88.3% it usually has in the final number), so it is a floor, not a settled fact. The final April figure comes out on June 19, 2026.
How many Canadians are collecting employment insurance?
In March 2026, 548,000 people were collecting regular Employment Insurance in Canada, up 0.4% on the month and +8.7% over 12 months, which works out to 44,000 more beneficiaries than in March 2025. The recent peak was 569,000 in November 2025, so technically the number is down from the top, but the 12-month trend is clearly up. The national unemployment rate from the Labour Force Survey sat at 6.7% in March, same as February and 0.2 point above January. The demographic breakdown shows that the ones who lost the most jobs were core-age women (25-54): +14.7% YoY (+18,000 people), and women over 55: +17.5% YoY (+8,900). Core-age men rose 6.1%.
Why did BC see a +22.2% increase in EI over 12 months?
British Columbia now has 62,500 people collecting employment insurance, up 3.8% in March alone and +22.2% over 12 months, the biggest annual jump among the large provinces. Ontario comes second with 186,560 beneficiaries (+11.1% YoY, +0.9% on the month), Alberta has 64,070 (+10.3% YoY, but -1.7% on the month, so it is stabilizing). Saskatchewan fell 4.4% on the month and Manitoba fell 1.7%, which suggests the labour market problem is concentrated in BC + Ontario + Alberta, not across the whole country. By occupation, education, law, social, community and government services rose 5.2% in March alone and 28.8% over 12 months (+15,000 people), the sector hit hardest at a recent pace. Trades, transport and equipment operators rose 1.0% on the month.
What does this tell a Brazilian sending out resumes right now?
It tells you the narrative of “Canada has a labour shortage, just show up and you’ll find work,” which was true in 2022-2023, does not match the March 2026 data. You have more people collecting EI, retail volume falling, department stores and building materials in decline. Sectors like education and government, which have historically been the most stable for a newcomer with a foreign degree, are exactly the ones that grew the most in EI over the last 12 months (+28.8%). That does not mean “don’t come,” it means reset the expectation. Whoever applied to 200 store jobs in Toronto and got silence is not doing anything wrong: they are running into a market with 186,560 Ontarians already collecting EI and retail volume falling. BC is at its worst moment (22.2% more EI YoY), Quebec was the only province with a retail decline in March, the map of “where to apply” has shifted and whoever arrives now needs to read it before picking a city. Important: starting with the April release, StatCan has stopped publishing analytical text alongside the monthly EI figure, only the table will come out. We are going to have to read the numbers without the official interpretation from here on.
Where can you find the full data?
The two original Statistics Canada releases are in The Daily of May 22, 2026: Retail trade, March 2026 (at www150.statcan.gc.ca/daily-quotidien/260522/dq260522a-eng.htm) and Employment Insurance, March 2026 (at www150.statcan.gc.ca/daily-quotidien/260522/dq260522b-eng.htm). Both carry regional tables, breakdowns by subsector (retail) or by occupation (EI), and historical series. The next retail figure (April 2026) comes out on June 19, 2026; the next EI (April 2026), on June 18, 2026, the latter already without analytical text, raw data only.
Frequently asked questions
Why did retail rise 0.9% if people are buying less?
BC saw a +22.2% increase in EI over 12 months, what is going on?
Which sector is laying off the most people in Canada in 2026?
Should a recent Brazilian newcomer expect difficulty finding a job in 2026?
When do the next retail and EI figures come out in Canada?
Sources
- Statistics Canada, Retail trade, March 2026 (The Daily, 22/05/2026): www150.statcan.gc.ca/daily-quotidien/260522/dq260522a-eng.htm
- Statistics Canada, Employment Insurance, March 2026 (The Daily, 22/05/2026): www150.statcan.gc.ca/daily-quotidien/260522/dq260522b-eng.htm
The Vancouver Letter
You made it this far. That tells me something.
The Vancouver Letter is the letter I wish someone had sent me the third time I tried for Canada, when I had no idea what I was doing wrong. Once a week, straight to your inbox. No products, no courses, just what actually works. I got your back.
Get immigration updates
Practical tips straight to your inbox.
Related articles

Canada's GDP stalled in Q1 2026, and the direction is downhill
Canada's GDP was flat (0.0%) in Q1 2026 after falling 0.2%. Technically not a recession yet, but the economy is losing steam.
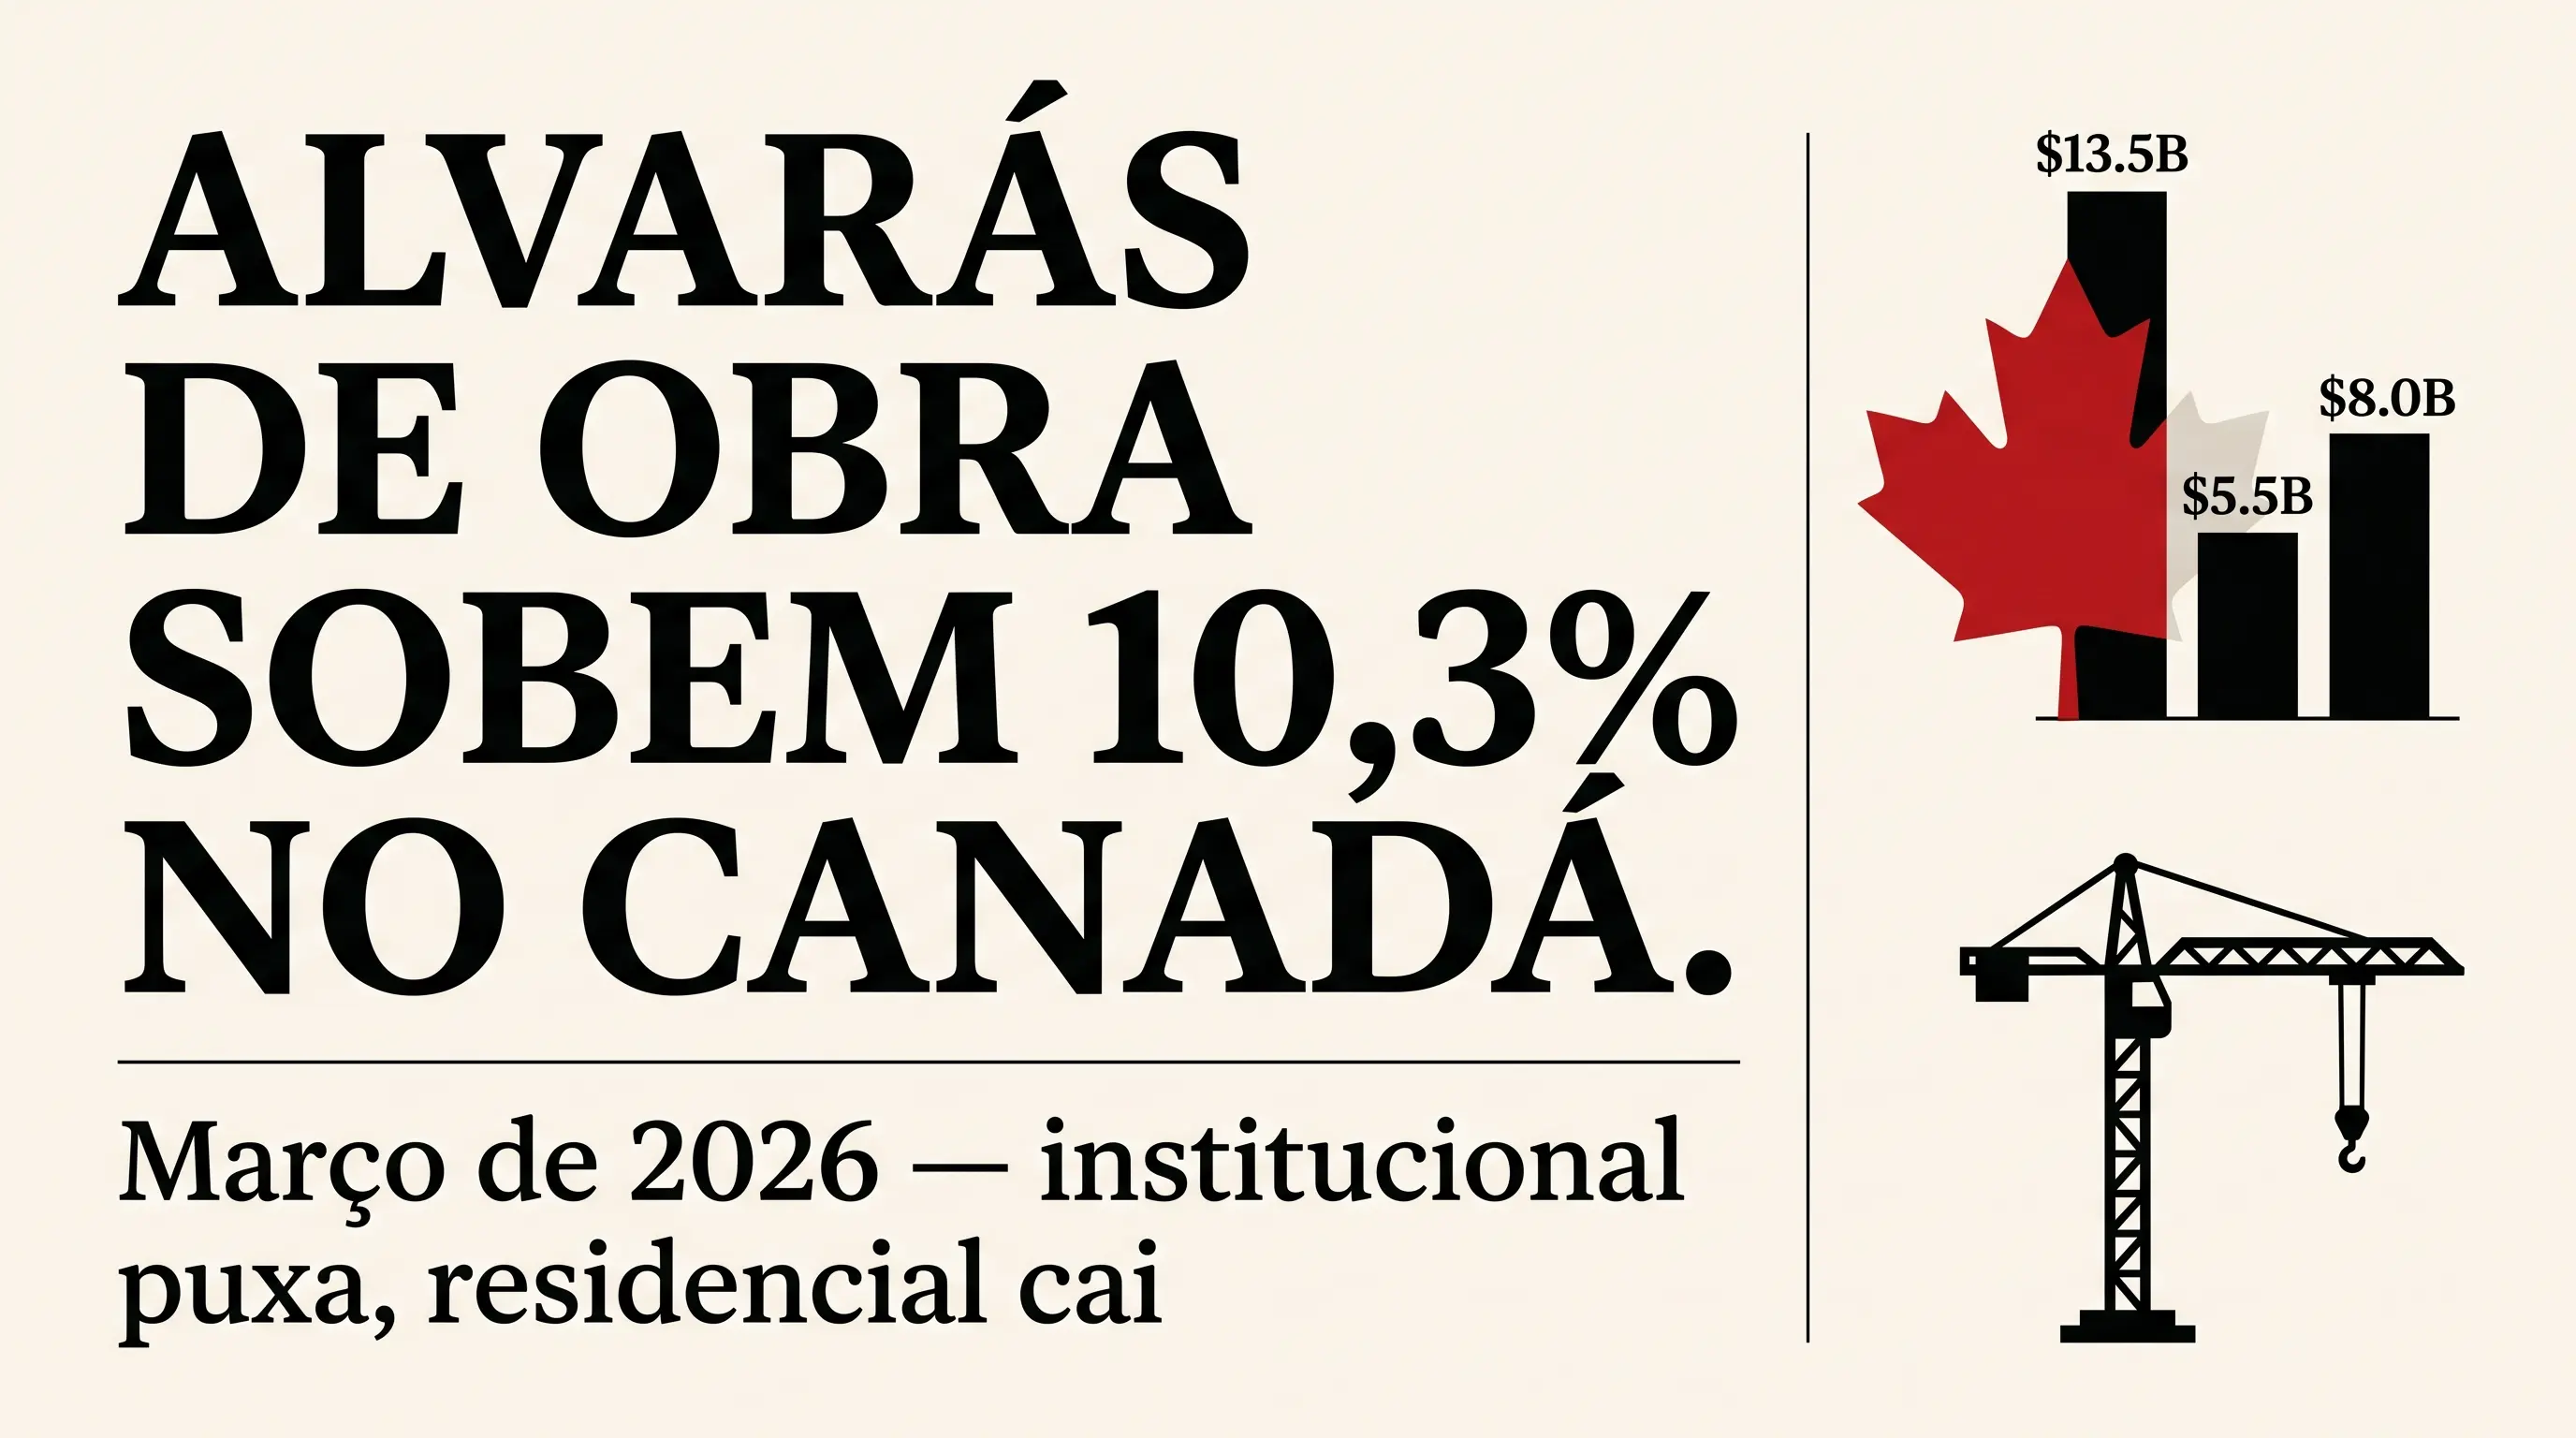
Canada building permits rise 10.3% in March 2026
Canada building permits hit CAD 13.5 billion in March (+10.3%). Vancouver led institutional with a hospital; multi-family fell in ON/QC.
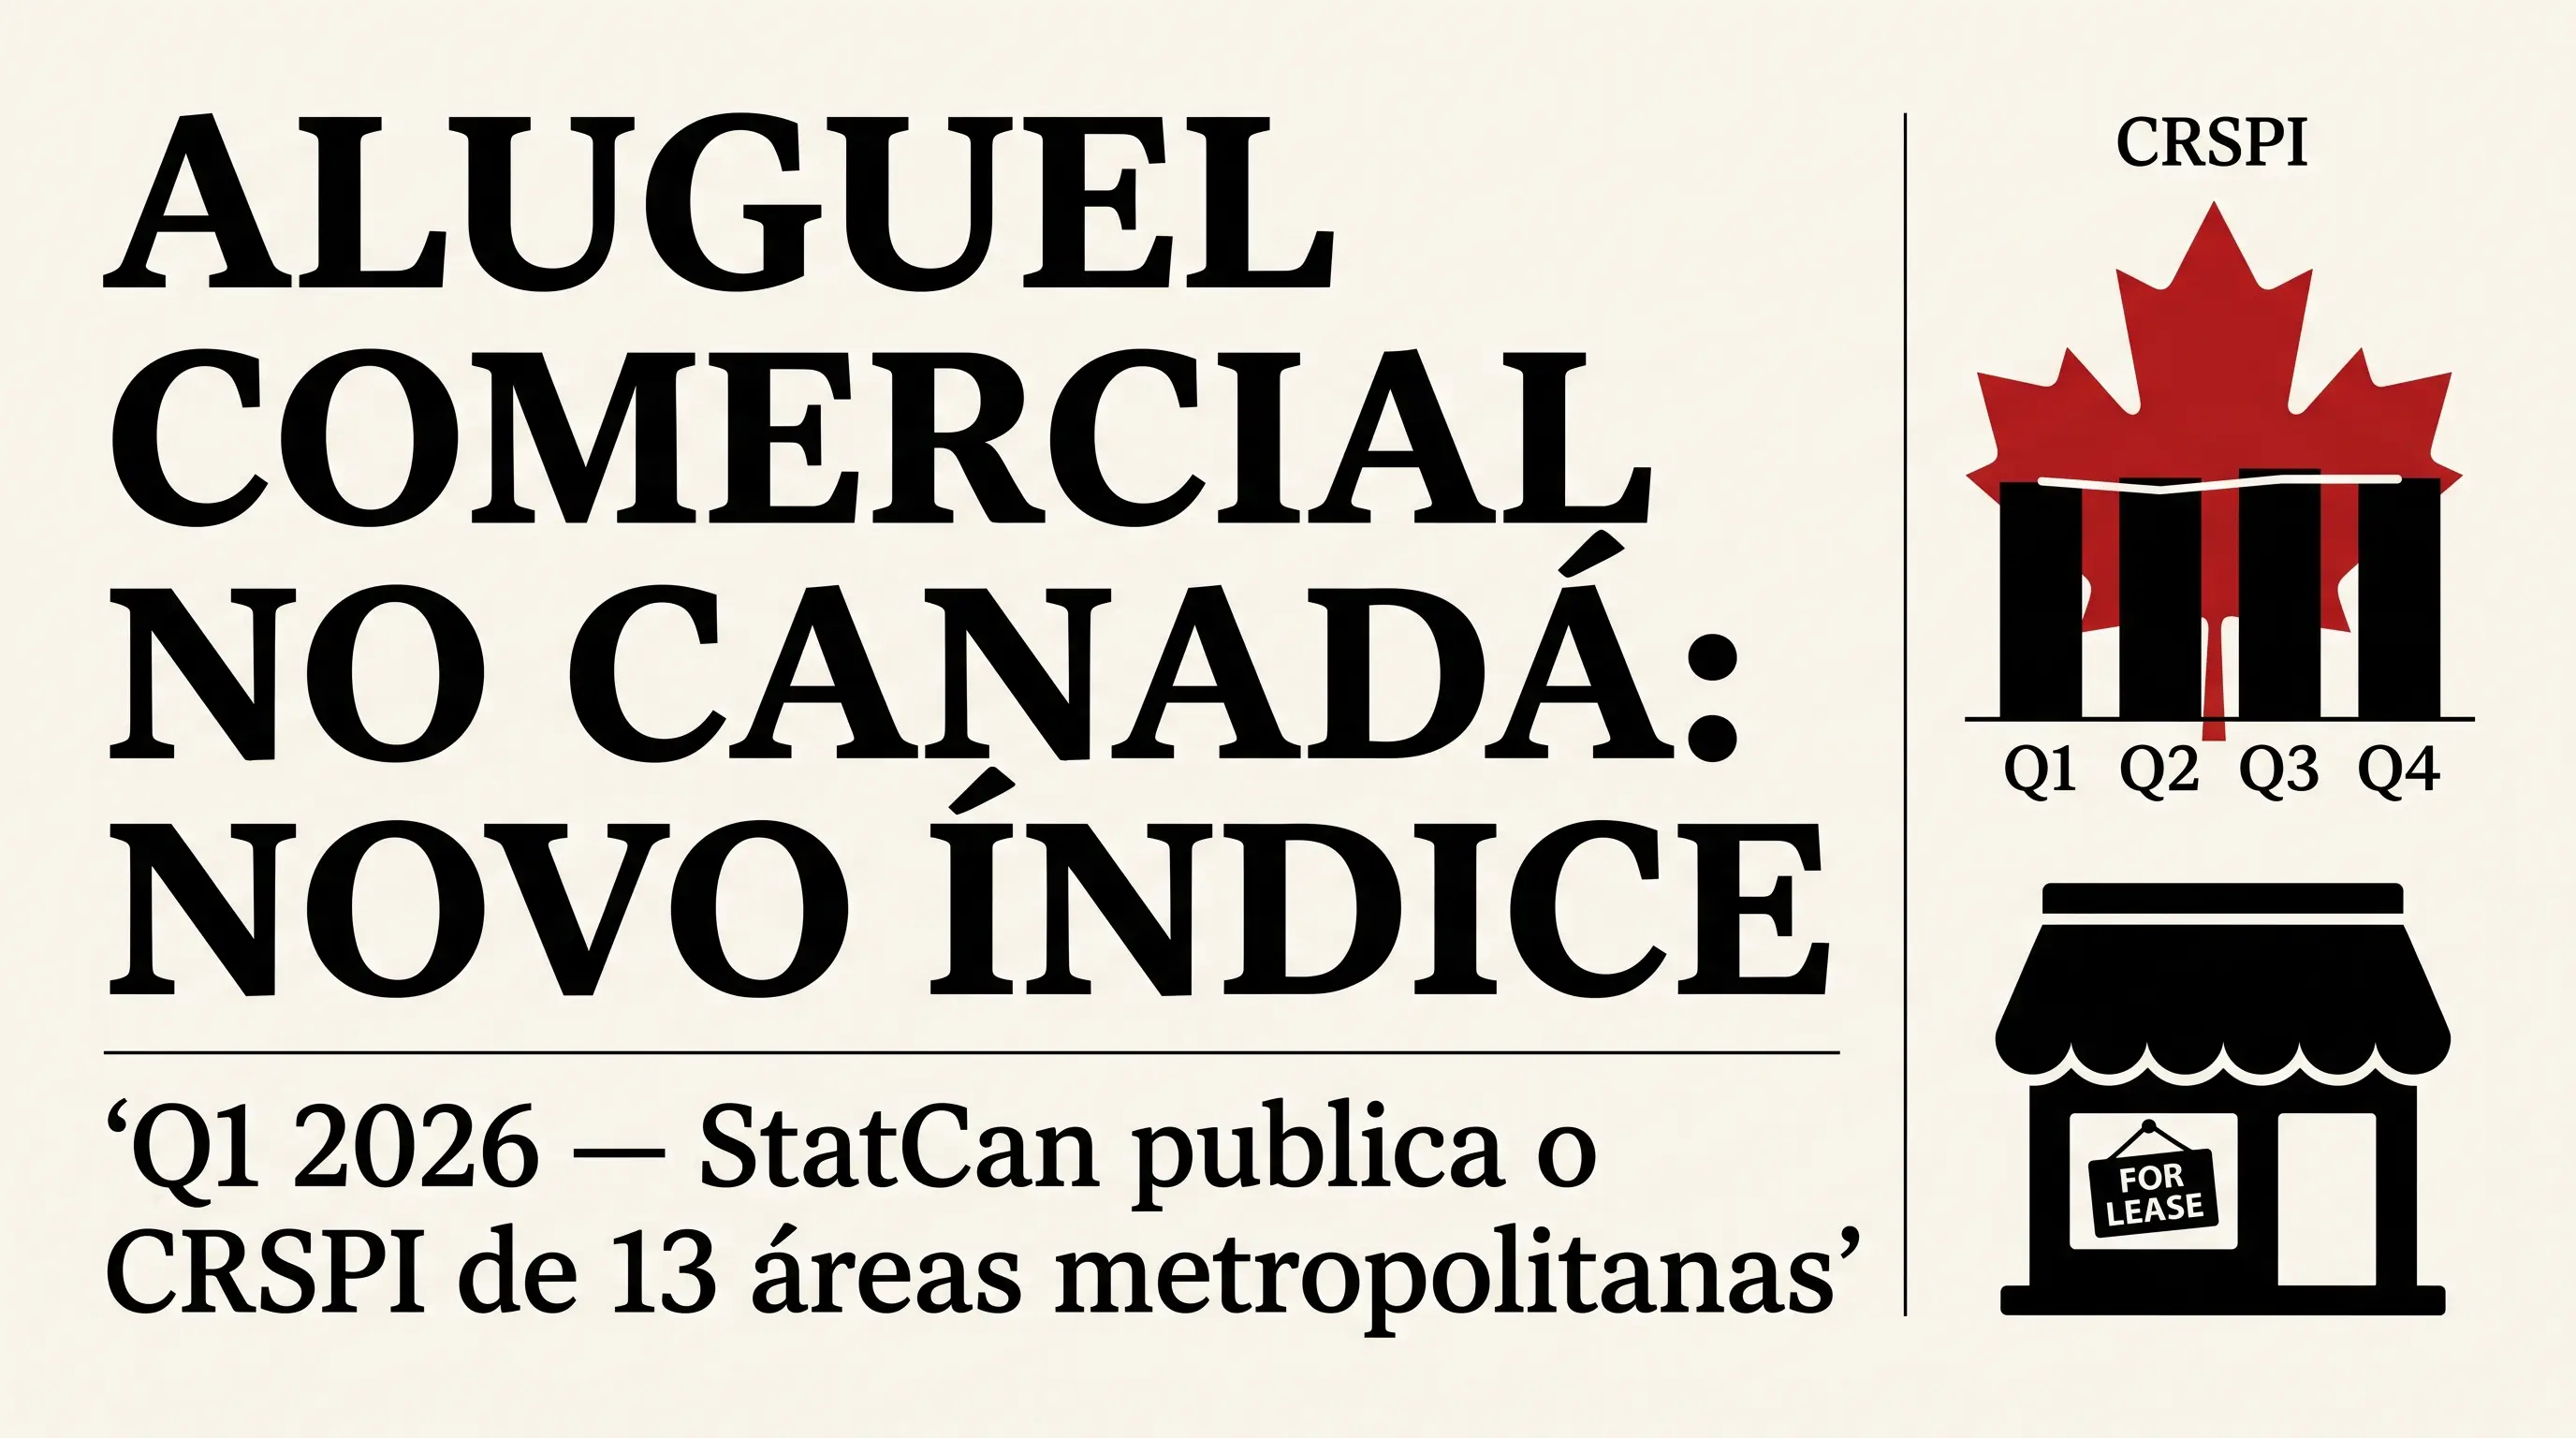
Commercial rent in Canada: StatCan's new CRSPI index is now available
StatCan released the CRSPI Q1 2026: commercial rent index for 13 CMAs plus the 4 largest provinces. What it means for a Brazilian who wants to start a business.